The problematic we will tackle in this article is the following: Finding a way of quantifying the quality of a bet? The ultimate goal here is to be able to choose a bet among a set of potential candidates based on clear mathematical considerations. By the end of this reading, you will know a very simple yet powerful formula which will enable you to sort your betting opportunities based on their inherent quality.
A bit of context
Before we begin any reasoning, let me give you an example of where the need to sort bets can arise. Imagine implementing a model that gives you the probability distribution of all possible scores for a Spanish La Liga game. From this distribution, you can derive the probability of a host of events like clean sheets, Asian handicaps, total goals scored, etc. All of these events are quoted on betting markets and have dependent outcomes, so picking the one that presents the best value opportunity could be your best move.
The good news is that there is a way of deriving this mathematically, but first things first, let me introduce you to the decimal odds system (if you do not already know it) which we will use throughout. In a later paragraph I will also give you formulas to convert other common odds systems to decimal so you can use them in the final formula.
Decimal odds and probability
If you are not familiar with this system, decimal odds simply represent the number of currency units (USD for example) a bookmaker would pay a punter who wins a bet on a unit notional. For example, a punter pays a bookmaker 10\$ to place a bet at 1.6. If the punter wins his bet, the bookmaker will pay him/her 16\$ (10x1.6) which would mean that the punter makes a profit of 6\$.
Let's formalise this definition with some useful mathematical notations. A unit bet \(B\) taken with decimal odds q either generates a profit of (q - 1) with probability p or a loss of 1 with probability (1-p).
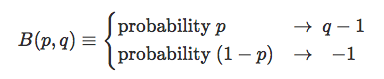
Let's calculate the expected profit/loss of our unit bet \( B \):
$$ \mathbb{E} [ B(p,q) ] = p(q-1)-(1-p) = pq-1 $$
A bet is said to be fair if its expected profit/loss is zero, which would be mathematically equivalent to:
$$ \mathbb{E} [ B(p,q) ] = 0 \leftrightarrow q = \dfrac{1}{p} $$
This shows that decimal odds represent the inverse of the probability of the event as implied by the market/bookmaker. This simple correspondance between odds and implied probability is what makes decimal odds so intuitively useful compared to all the other standards. For example, decimal odds of 2.0 correspond to an implied probability of 50%, while decimal odds of 4.0 corresponds to an implied probability of 25%.
Converting other odds standards to decimal odds
Fractional odds is a popular odds system. They represent the profit in currency units (USD for example) a punter would make by winning a bet on a unit notional. This is the odds system generally used in the Kelly formula. Its connection to the decimal odds system is very straightforward. If we call a fractional odds b, its equivalent decimal odds q is simply:
$$ q = b + 1 $$
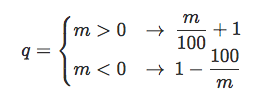
The moneyline is an odds system mainly used in the United States. Its relationship with decimal odds is a lot less straightforward but still easy to calculate. If the moneyline quote is positive, it represents the profit possibly generated by a 100USD notional bet. If the quote is negative, it represents the opposite of the notional of a bet that would generate a 100USD profit. So for moneyline odds m have their decimal odds equivalent q expressed as:
Probabilistic edge
While bettings odds are dictated by the market, the estimation of the probability of the underlying event is subjective. Betting opportunities arise when there is a discrepancy between the estimated probability and the one implied by the market. This discrepancy translates mathematically into the expected profit/loss of the unit bet moving away from zero. If the expected value becomes positive, there is a probabilistic edge in taking the bet. While it never makes sense to take a bet that has a negative expected value, are all the bets with the same positive profit/loss expectation equally attractive?
To develop our intuition, let's imagine 2 bets with same profit expectation: One with 60% probability of success at 2.0 odds, and the other with 40% probability at 3.0 odds. Which one of these two seems more attractive to take? Well, intuitively, the first one as its profit probability is the highest. So our immediate conclusion is that looking at expectation alone seems incomplete to really assess the quality of bets. In order to reason further, we need to imagine taking each bet a very large number of times, simulate independent outcomes for the final result and study the distribution of our virtual cumulated profit/loss.
Thinking big and positive
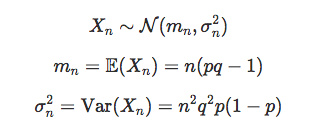
The good news is that we do not need to simulate all these random outcomes to know the distribution of our cumulated virtual profit/loss. All thanks to the Central Limit theorem which tells us that the more simulations we make, the more our cumulated profit/loss tends to be Normally distributed. If we call \(X_n\) the sum of n independent unit bets, we can write that for n large enough:
Now that we have characterised the profit/loss distribution, we can express the probability that our final profit/loss is positive. We can express it using the continuous distribution function \(\Phi\) of a Standard Normal variable:
$$ \mathbb{Pr}(X_n > 0) = 1 - \Phi \left( -\dfrac{m_n}{\sigma_n} \right) = \Phi \left( \dfrac{m_n}{\sigma_n} \right) $$
If we name r the ratio between the expectation and the standard deviation of the variable \(X_n\), we can see that it is a function of p and q, but not of n:
$$ r(p,q) = \dfrac{m_n}{\sigma_n} = \dfrac{p - 1 / q}{\sqrt{p(1-p)}} $$
Also, since \(\Phi\) is a monotonically increasing function, we can write that:
$$ \Phi(r_1) < \Phi(r_2) \Leftrightarrow r_1 < r_2 $$
Finally, we can conclude that this ratio rises with the probability of having a cumulated profit/loss greater than zero which makes it a quality indicator for bets. Let's use it in a numerical example using the two bets with the same expectation defined previously:
$$ r(0.6,2.0) = \dfrac{0.6 - 1.0 / 2.0}{\sqrt{0.6 * 0.4)}} > r(0.4,3.0) = \dfrac{0.4 - 1.0 / 3.0}{\sqrt{0.4 * 0.6)}} $$
The indicator confirms the intuitive conclusion we had before namely that the bet with the highest probability of profit is superior if they both have the same positive expectation. Another important thing to note is that this ratio shares the sign of the expectation, so it can be used to determine if taking a particular bet has probabilistic edge.
Conclusion
The concept of probability is easy to define but hard to interpret. Learning how to reason in a probabilistic setting is mostly about learning to quantify the importance of luck. Hopefully, this very simple proof and formula will be useful to you when making decisions linked to risk taking.
If you like this post, follow me on Twitter and get notified on the next posts.